Football Ground Map Statistics - Top-Rated Grounds
Which is the top-rated ground in Championship, England?
View Championship grounds by
Overall Rating •
Location •
View •
Facilities •
Food •
Police •
Atmosphere
Best ground in the Championship
| # |
Team(s) |
Ground |
Average |
Visits |
| 1 |  Wolverhampton Wanderers Wolverhampton Wanderers | Molineux |  | 67,661 |
| 2 |  Derby County Derby County | Pride Park | | 64,017 |
| 3 |  Southampton Southampton | St Mary's Stadium | | 50,048 |
| 4 |  Cardiff City Cardiff City | Cardiff City Stadium | | 20,833 |
| 5 |  Sheffield United Sheffield United | Bramall Lane |  | 70,418 |
| 6 |  Charlton Athletic Charlton Athletic | The Valley | | 63,998 |
| 7 |  West Bromwich Albion West Bromwich Albion | The Hawthorns | | 64,730 |
| 8 |  Norwich City Norwich City | Carrow Road | | 53,850 |
| 9 |  Swansea City Swansea City | The Liberty Stadium | | 25,057 |
| 10 |  Bolton Wanderers Bolton Wanderers | Toughsheet Community Stadium | | 58,590 |
| 11 |  Middlesbrough Middlesbrough | The Riverside Stadium | | 46,456 |
| 12 |  Stoke City Stoke City | bet365 Stadium (The Britannia Stadium) | | 57,828 |

Best ground in the Championship
| # | Team(s) | Ground | Average | Visits |
|---|
| 13 |  Preston North End Preston North End | Deepdale | | 55,620 |
| 14 |  Blackburn Rovers Blackburn Rovers | Ewood Park | | 65,192 |
| 15 |  Bristol City Bristol City | Ashton Gate | | 50,303 |
| 16 |  Birmingham City Birmingham City | St Andrew's | | 68,068 |
| 17 |  Portsmouth Portsmouth | Fratton Park | | 53,324 |
| 18 |  Millwall Millwall | The Den | | 46,580 |
| 19 |  West Ham United West Ham United | London Stadium (Olympic Stadium) | | 14,212 |
| 20 |  Queens Park Rangers Queens Park Rangers | Loftus Road |  | 70,501 |
| 21 |  Watford Watford | Vicarage Road | | 65,051 |
| 22 |  Burnley Burnley | Turf Moor | | 53,697 |
| 23 |  Wrexham Wrexham | The Racecourse Ground | | 32,146 |
| 24 |  Lincoln City Lincoln City | Sincil Bank | | 33,048 |

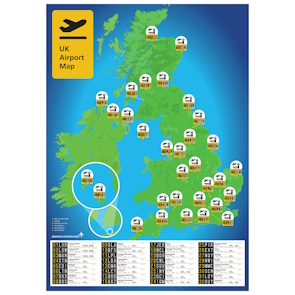
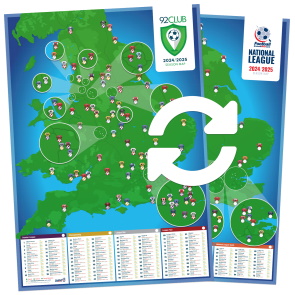
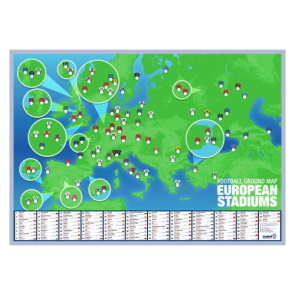
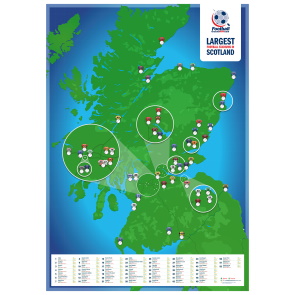
Football posters and wall charts